campusM Analytics Subject Areas
The following subject areas, dimensions, and fields are available. The first section,Shared Dimensions, presents dimensions that appear in more than one subject area.
Attribute fields are presented in normal text; calculated measures are presented in bold.
Shared Dimensions
The following dimensions / fields appear in more than one subject area.
Dates
"Key" fields are integers, and should be used for calculations and filters. For example, a Year Key value could be 2018.
Non-key fields are display strings, and should be used for presenting data. For example, a Year value could be "2018".
- Year Key – E.g. 2018
- Year – E.g. "2018"
- Quarter Key – E.g. 2
- Quarter – E.g. "Q2"
- Month Key – E.g. 4
- Month – E.g. "April"
- Week Key – E.g. 24
- Week – E.g. "Week 24"
- Date Key – E.g. 6
- Date – E.g. "6"
Profiles
For more information, see Managing Profiles.
- Profile
- Profile Group
Institutions
- Institution – The institution name.
Anonymized Usage Subject Area
Dates
See Dates.
Profiles
See Profiles.
Institutions
See Institutions.
Active Users
Information about active users' devices and activities.
- Anonymous Person ID
- Device
- Device Model
- Browser
- OS Version
- Platform Code
- Menu Clicks
- Page Hits
- Sessions
Attendance Subject Area
Dates
See Dates.
Institutions
See Institutions.
Attendance
- Check In-Out Type
- Platform Code
- Check Ins
- Events
- Locations
- Persons
Banner Usage Subject Area
The banner usage data provides information about how many users clicked on each image in all the home page banners of the institution. This analysis cannot separate clicks from different banner tiles – all banner images are processed as one. Both normal banners (configured in App Builder) and legacy banners (configured in App Settings > Home Page Banners) are included in this subject area.
Deleting a banner tile also removes it from our analytics platform. As historic analytics are important for year-to-year comparisons, we recommend using the Disable option rather than the Deletion option.
Dates
Org Code plus the fields listed under Dates, above.
Profiles
-
Org Code
-
Profile
-
Profile Group
-
Profile ID
-
Profile Group ID
Institutions
- Institution – The institution name
- ORG_CODE
Banner Usage
- Menu Clicks
- Menu Description:
- For normal banners: the description of the image
- For legacy banners: the Alt Text of the image
Devices Subject Area
Dates
See Dates.
Profiles
See Profiles.
Institutions
See Institutions.
Device Usage
Information about user devices and activities.
- Device
- Device Model
- Browser
- OS Version
- Platform Code
- Page Hits
- Sessions
Home Page Subject Area
Information about the number of times each tile was selected on the homepage.
When you delete a tile/tile container, the Menu ID displays in the analytics platform instead of its name. However, deleting a tile/tile container still removes its display name from campusM.
Dates
See Dates.
Profiles
See Profiles.
Institutions
See Institutions.
Home Page
Information about the tiles that were selected from the homepage
- Menu – The name of the tile
- Menu Clicks – The number of times the tile was selected
- Container – The name of the tile container. If a tile click came from within a certain container, its name displays in that field. For clicks on tiles that are not in a container, the value for Container field is "null".
- Navbar Tab – The name of the tab in the Navbar.
- Navbar Taps – The number of times the tab was selected.
Using the Menu Clicks metric with Navbar data or the Navbar Taps metric with Menu data in the same graph or table could lead to errors or incorrect results. To ensure correct results, always separate graphs and tables when analyzing Menu Clicks and Navbar Taps.
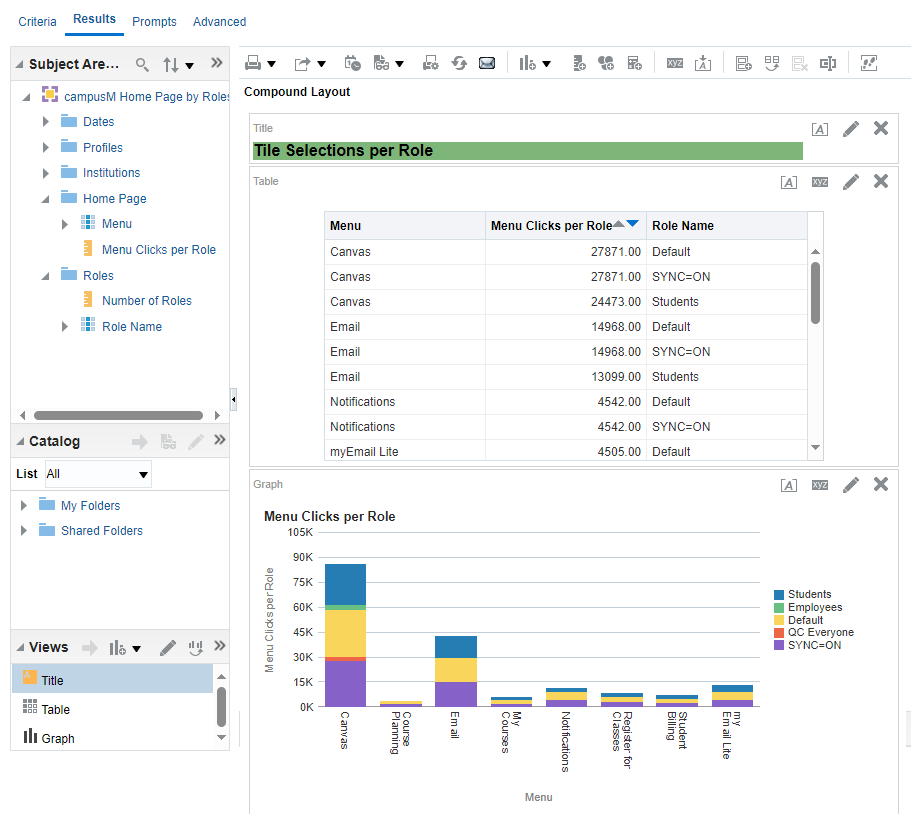
Home Page by Roles Subject Area
Information about the number of times each tile was selected on the homepage, broken down by user roles.
When you delete a tile/tile container, its Menu ID displays in the analytics platform instead of its name. However, deleting a tile/tile container still removes its display name from campusM.
In this subject area, each tile selection is counted once for each role the user has. Thus, for example, if the user has three roles, when they select a tile once in the homepage, their selection appears three separate times in the data – once for each of their roles. To view the number of times a tile was selected, use the Home Page subject area.
Dates
See Dates.
Profiles
See Profiles.
Institutions
See Institutions.
Home Page
Information about the tiles that were selected from the homepage
- Menu – The name of the tile
- Menu Clicks per Role – The number of times the tile was selected, calculated individually per user role
- Container – The name of the tile container. If a tile click came from within a certain container, its name appears in that field. For clicks on tiles that are not in a container, the value for Container field is "null".
- Navbar Tab – The name of the tab in the Navbar.
- Navbar Taps – The number of times the tab was selected.
Using the Menu Clicks metric with Navbar data or the Navbar Taps metric with Menu data in the same graph or table could lead to errors or incorrect results. To ensure correct results, always separate graphs and tables when analyzing Menu Clicks and Navbar Taps.
Roles
Information about the user roles who selected the tiles from the homepage
- Number of Roles – The number of distinct user roles included in the menu-click data
- Role Name – The names of the user roles included in the menu-click data
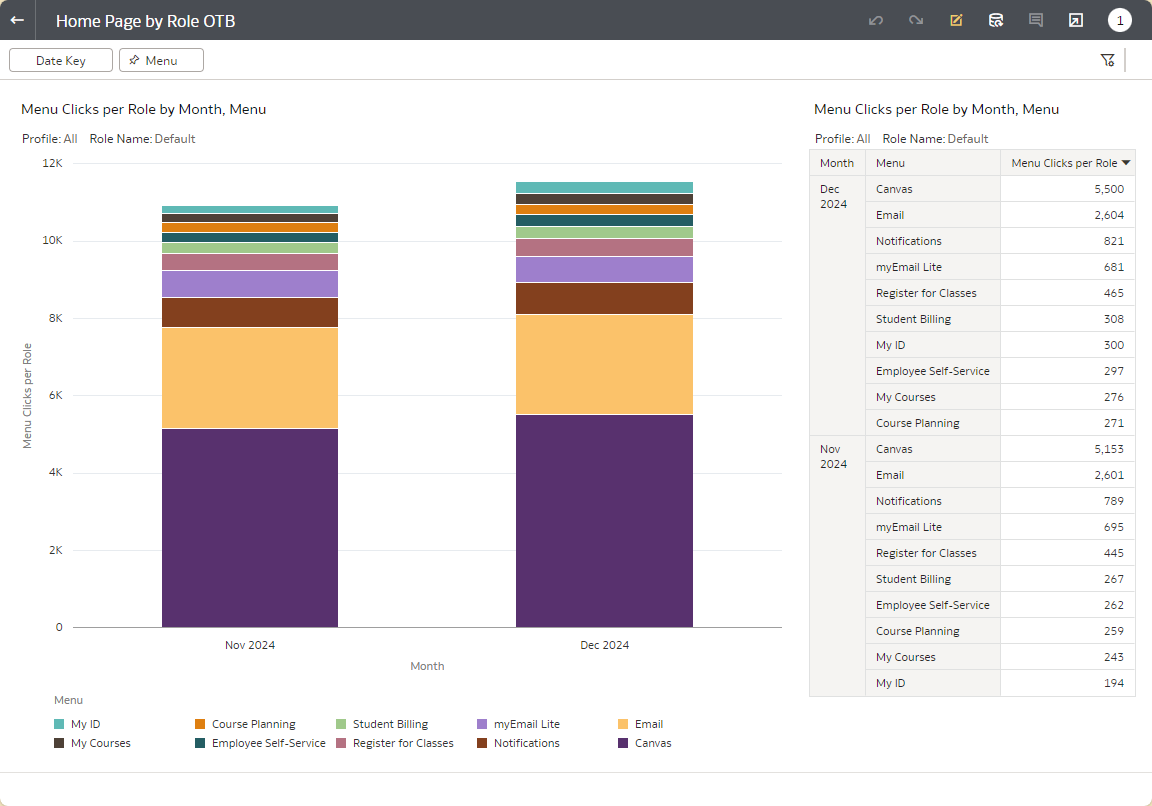
OTB Report
An out-of-the-box report for this subject area is available:Home Page by Role OTB.
Pages Subject Area
Information about the number of times each page of the app was accessed from any location within the app (e.g., the homepage, the navigation bar, or content pages).
When you delete a content page, the Page ID displays in the analytics platform instead of its name. However, deleting a page still removes its display name from campusM.
Dates
See Dates.
Profiles
See Profiles.
Institutions
See Institutions.
Page Usage
Information about the pages that were accessed from any page within the app
- Page Desc – The description of the target page
- Page Hits – The number of times the target page was accessed
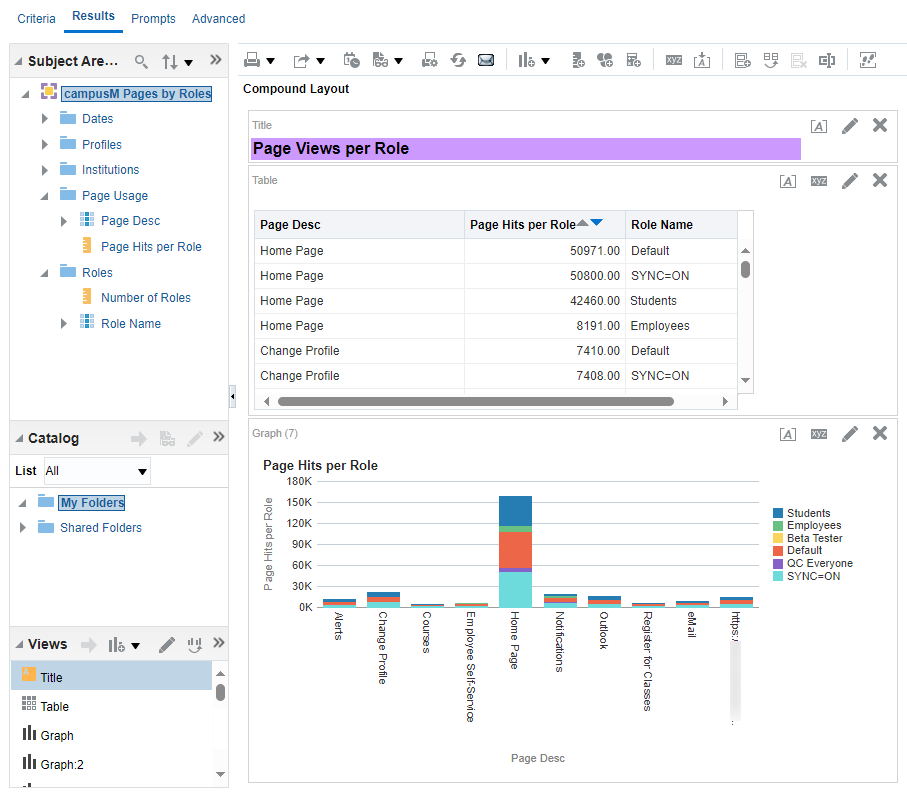
Pages by Roles Subject Area
Information about the number of times each page of the app was accessed from any location within the app (e.g., the homepage, the navigation bar, or content pages), broken down by user roles.
When you delete a content page, the Page ID displays in the analytics platform instead of its name. However, deleting a page still removes its display name from campusM.
In this subject area, each page view is counted once for each role the user has. Thus, for example, if the user has three roles, when they open a page once in the app, their action appears three separate times in the data – once for each of their roles. To see the number of times a page was viewed, use the Pages subject area.
Dates
See Dates.
Profiles
See Profiles.
Institutions
See Institutions.
Page Usage
Information about the pages that were accessed from any page within the app
- Page Desc – The description of the target page
- Page Hits – The number of times the target page was accessed, calculated individually per user role
Roles
Information about the roles of the users who selected the pages
- Number of Roles – The number of distinct user roles included in the page-selection data
- Role Name – The names of the user roles included in the page-selection data
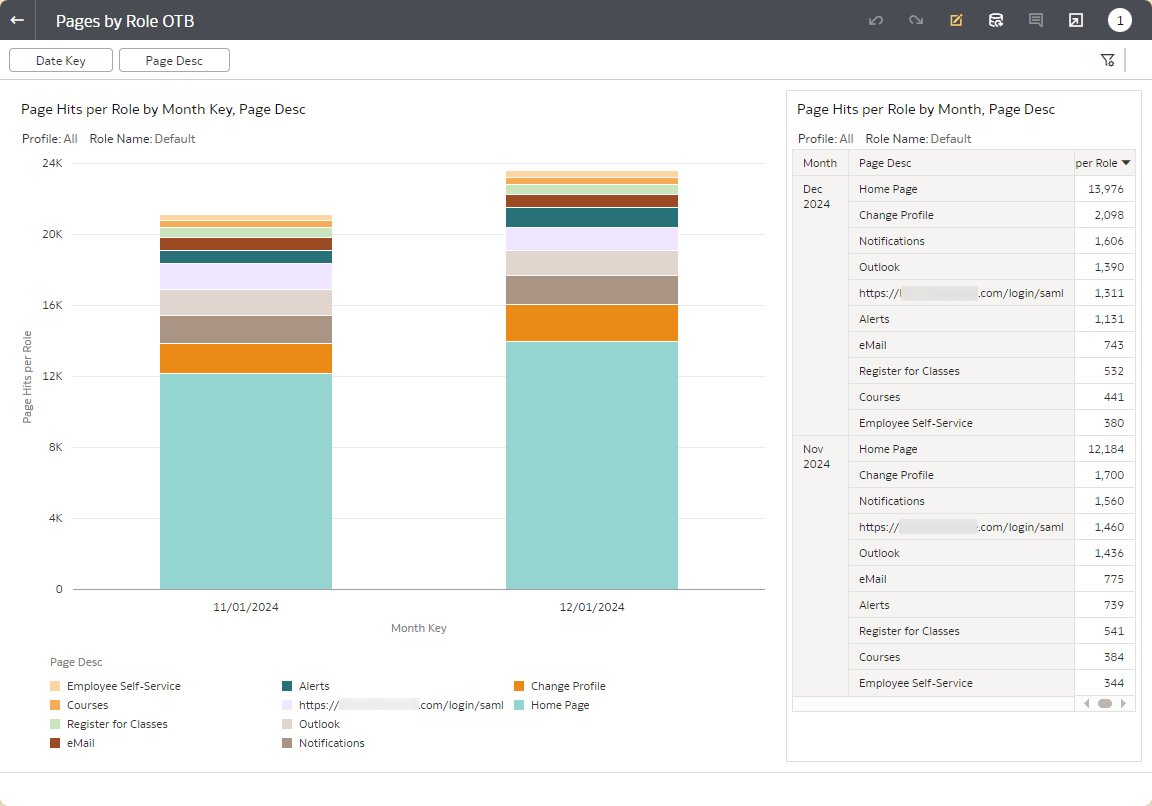
OTB Report
An out-of-the-box report for this subject area is available:Pages by Role OTB.
User Registration Subject Area
Dates
See Dates.
Institutions
See Institutions.
Registrations
Information about users registered and manually managed in the App Manager; see Managing End-Users.
- New Users
Notifications Subject Area
Please note that Profiles are not available for this subject area.
Dates
See Dates.
The date associated with each notification is the effective date at which the notification was sent to the user device.
Institutions
See Institutions.
Notifications
Information about the app engagement through campusM notifications.
-
Number Sent — The number of notifications sent by the administrators
-
Personalised — Displays whether the notification was personalised or not. Personalised notifications are notifications with fewer than 10 recipients.
-
Number Received — The number of expected recipients of a notification at the time the notification was created
-
Number Read — The number of notifications read by the recipients
-
Engagement — The engagement rate (Number Read divided by Number Received)
Regional
Information about the notification engagements across one of three regions (EMEA, NA, APAC).
-
Number Sent — The sum of the numbers of notifications sent by the administrators across the region
-
Personalised — Displays whether the notification was personalised or not. Personalised notifications are notifications with fewer than 10 recipients.
-
Number Received — The number of expected recipients of a notification across the region at the time the notification was created
-
Number Read — The number of notifications read by the recipients across the region
-
Engagement — The engagement rate (Number Read divided by Number Received) across the region
Page tags: article:topiccontent:Documentationproduct:campusmlang:englishcommunity:training_materials