Monitoring App Usage
Viewing Feedback
When configuring app feedback, you can configure that administrators receive feedback by email. To configure app feedback, see Configuring App Feedback.
You can configure which feedback types are available to users (App Settings > Feedback > Feedback Configuration): Feedback, Problems, and Ideas.
You can view feedback in the App Manager in the pages Feedback (App Settings > Feedback > Feedback), Problems (App Settings > Feedback > Problems), and Ideas (App Settings > Feedback > Ideas). Each page presents a list of feedback messages; for information about working with lists, see Working with Lists. You can filter each list by searching the list or by selecting one of the categories on the right.
Each feedback message includes the following information:
- Feedback entered - The date and time of the message.
- Platform
- OS version
- Device model
- App or page - Whether this is feedback about the current page or the app in general.
- Page title - The page from which this message was submitted.
- Comments - The end-user's message.
- Rating - The end-user's rating of the page/app.
To download the entire list as a CSV file, select Download CSV. The downloaded file is named feedback.csv and includes all feedback, not just the feedback currently visible according to the selected filter (if any).
Viewing App Usage Statistics
You view statistics about app usage across all platforms on the Insight Analytics page (Insight Analytics).
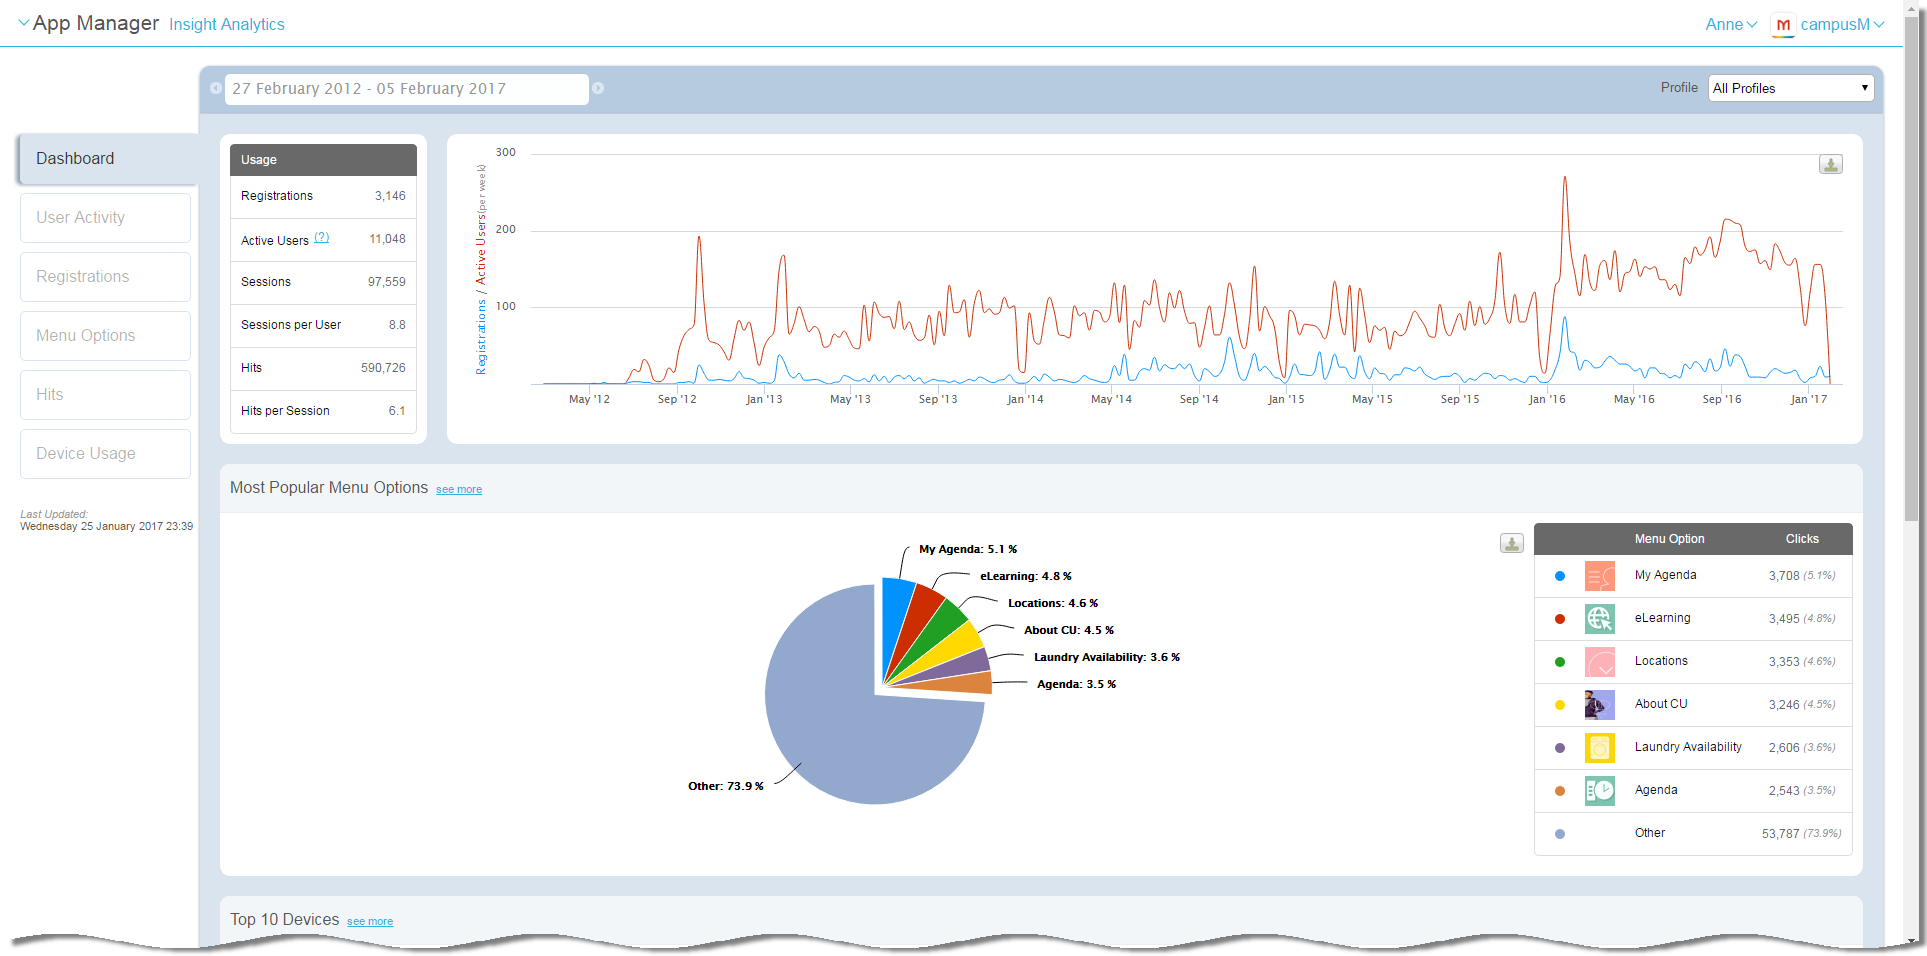
- App data is compiled on a weekly basis.Last Updated on the left indicates the last time the data was uploaded.
- Data can be viewed by profile or for all profiles. Select one, or all, profiles in the Profile dropdown list.
- Data is presented for a specific date range. Use the range arrows to view additional dates, or select the image and select a date range option.
 Date Range Arrows
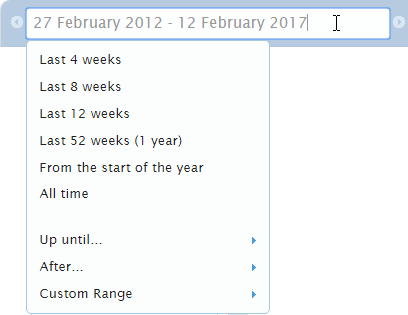 Date Range Options
 - Hover over a graph or select see more in an area to view more information.
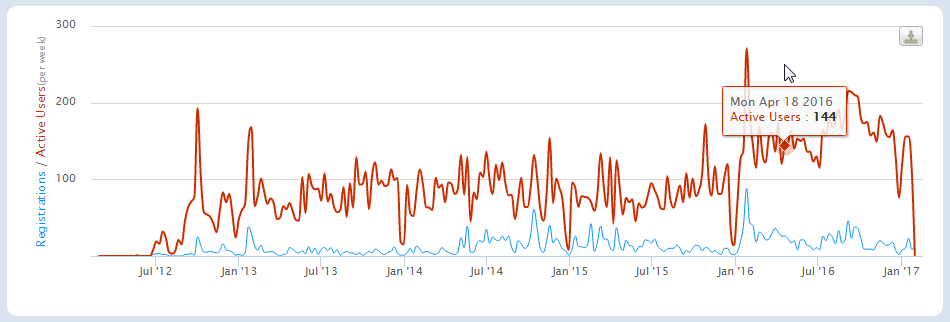 Interactive Graph
 - To download a chart, select the download icon
 and select the desired format.
 - Summary information appears in the Dashboard tab; select any other tab to view additional details. The other tabs are:
- User Activity- Usage by end-user.
- Registrations- End-user registrations. Select Download CSV to download the data in CSV format.
- Menu Options- Usage by static service.
- Hits- End-user activity (selects) across all services.
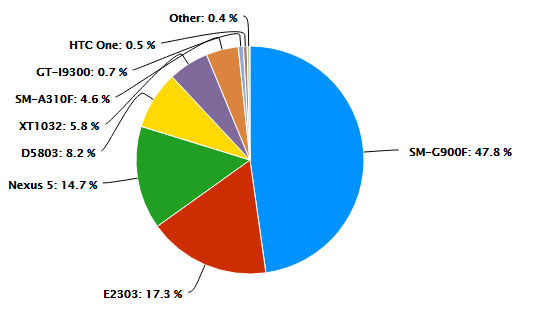
- Device Usage- Usage by device and OS.
On the Device Usage tab, the graph displaying Device Usage uses the model identifiers for iOS devices rather than the more commonly used generation numbers (iPhone 7, etc).
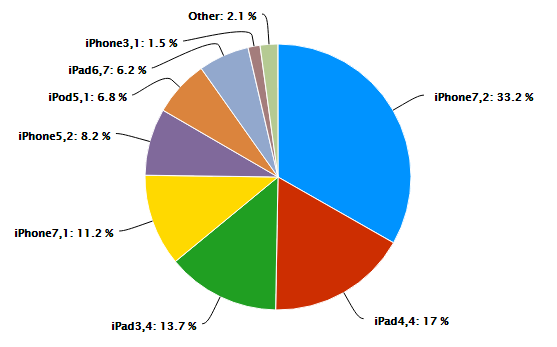
The data is collected directly from the device and is the data supplied by the iOS platform. The table below lists the model identifiers and generation versions.
| Model Identifier | iPhone Generation |
|---|---|
| iPad 3,1, 3,2 and 3,3 | iPad 3 |
| iPad 3,4, 3,5 and 3,6 | iPad 4 |
| iPad 4,1, 4,2 and 4,3 | iPad Air |
| iPhone 6,2 | iPhone 5s |
| iPhone 7,1 | iPhone 6 Plus |
| iPhone 7,2 | iPhone 6 |
| iPhone 8,1 | iPhone 6s |
| iPhone 8,2 | iPhone 6s Plus |
| iPhone 8,4 | iPhone SE |
| iPhone 9,1, 9,3 | iPhone 7 |
| iPhone 9,2 and 9,4 | iPhone 7 Plus |
For Android devices, the graph uses Android model IDs.
You can use the model number to search for the specific device on http://www.gsmarena.com. The Library Mobile does not maintain an up-to-date list of devices.
Page tags: article:topiccontent:Documentationproduct:campusmlang:englishcommunity:training_materialsproduct:alma_specto