
Analytics Usage Tracking
Create reports concerning the usage of Alma Analytics
The Analytics Usage Tracking subject area allows you to create reports concerning the usage of Alma Analytics and is able to answer the following types of business questions:
- Which Alma user ran Analytics reports/dashboards? When were the reports/dashboards run? Which reports/dashboards were run (including a path to the reports)?
- How long did the reports take to run (total time in seconds)? How many times were the reports run (number of queries)?
- Which percent of reports ended successfully or failed?
- Which subject areas are used the most? How many times were the subject areas used? How many users use the subject areas? How long were queries run on each subject area?
- Which users use which specific subject areas?
- What is the analytics usage for a day of the week? an hour of the day? a week of the year? a month of the year?
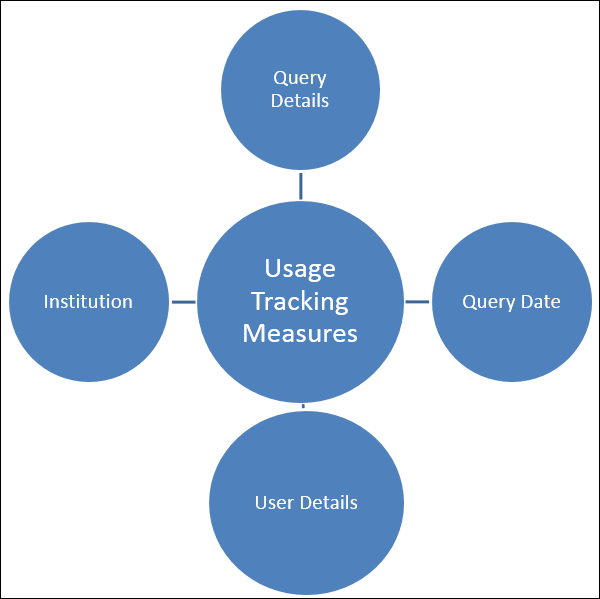
- To use the Usage Tracking subject area, you must set the enable_usage_tracking parameter (see Analytics Configuration - Other Settings) to true
- Additionally, the Analytics Usage Tracking job must be enabled.
- This subject area becomes available a week after the parameter is set and the data included is from one week prior to the parameter's activation. For example, if the parameter was set to true on November 13th, the Usage Tracking subject area will be available by November 20th and will include data as of November 6th.
- Analytics Usage Tracking data is updated once a week. The nightly job which is run Monday night will extract to analytics all data from the previous week up to and including the previous Saturday. Thus, for example, the job run Monday January 21 will include all data up to and including Saturday January 19.
Field Descriptions
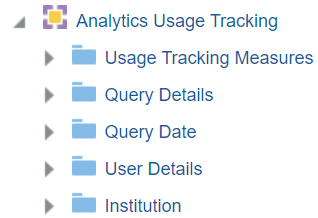
Usage Tracking Measures
The Usage Tracking Measures table is a measures table that stores details on usage tracking.
| Field | Description | Additional Information | Data Type | Data Size |
|---|---|---|---|---|
| Average Rows Retrieved | The average number of rows retrieved by the report. | INT | ||
| Average Time in Secs | The average time to run the report. | DOUBLE | ||
| Num of Days Accessed: Dashboards/Workbooks per User | The number of days that a user accessed the Dashboards/Workbook. | This value was limited to daily measuring, because the alternative of counting every action done on the workbook, such as applying a filter or moving to a different tab, would inflate the count. | DOUBLE | |
| Number of Queries | The number of standalone reports that ran, as well as the number of reports in dashboards and Data Visualization sections in workbooks that ran when the dashboard or workbook opened. | Count is per report path, meaning for example, that accessing a canvas in a Data Visualization will count all the sections that appear on the canvas.
Note that the usage tracking measure "Number of Queries" does not distinguish between reports run from a link within Alma (an analytics object) and reports created manually in the Oracle analytics interface. Therefore, you cannot create reports that display usage from just one of those sources. |
INT | |
|
Total Rows Retrieved |
The total number of rows retrieved by the report. | INT | ||
| Total Time in Secs | The total time the queries took in seconds. | DOUBLE |
Query Details
The Query Details table is a dimension table that stores details on queries.
| Field | Description | Additional Information | Data Type | Data Size |
|---|---|---|---|---|
| Data updated as of | The last date the usage data was updated. | DATETIME | ||
| Dashboard Tab/Workbook Canvas Name | The name of the individual dashboard tab or workbook canvas accessed. | If there is no name given to the tab/canvas in the dashboard, the tabs/ canvases are given numbers. | VARCHAR | 1000 |
| Dashboard/Workbook Path | The path of the dashboard or Data Visualization Workbook. | VARCHAR | 1000 | |
| DV Section | The specific section within the Data Visualization workbook (single visualization). | If there is no title given to the section in the dashboard, the sections are given numbers.
In Data Visualization workbooks, Data Visualization sections are similar to reports in a dashboard, except that Data Visualization sections cannot be accessed as a standalone the way that reports in a dashboard can. |
VARCHAR | 4000 |
| End Hour Min | The end hour. | VARCHAR | 10 | |
| End Time | The end time. | TIMESTAMP | ||
| Error Code | The code of the error. | VARCHAR | 250 | |
| Error Text | The text of the error message. | VARCHAR | 250 | |
| Number of Rows per Report | The number of rows in the report. | When a large amount of data is returned from a query, this column is not populated until the user displays all of the data. | INT | |
| Object Type | The Alma/Primo/Esploro object type.
Not available for analyses that do not have an Alma/Primo/Esploro object. |
Possible Values:
|
VARCHAR | 255 |
| Query Status | The query status. | VARCHAR | 39 | |
| Query Type | Displays the system in which the query runs. | Possible values:
|
VARCHAR | 100 |
| Report Duration | The time the report took to run. | DOUBLE | ||
| Report Path | The path to a specific report within the catalog. | The path to a specific report usually beginning with shared/.
The report cannot be accessed directly from a browser, only within the OAS. If the report is a Data Visualization section, it has an internal path, as it cannot be accessed as a standalone. |
VARCHAR | 1024 |
| Report URL | The URL of the report that ran. | This field displays the URL of specific reports. If the analysis type is dashboard, the URL to a report within the dashboard tab is displayed. | VARCHAR | 2071 |
| Start Hour Min | The start hour. | VARCHAR | 10 | |
| Start Time | The start time. | TIMSTAMP | ||
| Subject Area | The subject area. | VARCHAR | 255 |
Query Date
The Query Date table is a dimension table that stores details on the query date.
| Field | Description | Additional Information | Data Type | Data Size |
|---|---|---|---|---|
| Query Date | The Query date of the analytics object. | The date in the format DD/MM/YYYY | DATE | |
| Query Day Name | The query day name. | CHAR | 10 | |
| Query Day of Week | The query day of the week. | INT | ||
| Query Week Number | The number of the week of the year. | There are 52 weeks in a year. | VARCHAR | 2 |
| Query Month Key | The month of the date in number format. | For example - February will show the number 2 in this column. This field is useful when you want to sort by month. | INT | |
| Query Month | The month of the date in text format. | The month, for example, "February" | VARCHAR | 20 |
| Query Quarter | The quarter of the year in which the query request was modified. | The quarter of the date in a display format such as Q1 | VARCHAR | 20 |
| Query Year | The year in which the query request was modified. | The year of the date in the format YYYY . For example - 2025 | VARCHAR | 20 |
| Query Year Month | The query year and month. | VARCHAR | 15 | |
| Query Year Month Key | The query year and month. | The year and the month of the date in the format YYYY-MM . For example - 2025-02 | VARCHAR | 250 |
| Query Year-Month | The year and the month in which the query request was modified. | The year and the month in the format YYYY-MM | VARCHAR | 250 |
| Query Full Month | The year and month that the query request was modified. | The month in text format and the year. For example - Feb 25 (for February 2025) | VARCHAR | 20 |
| Query Date Filter | Used to filter reports by date. |
Possible answers:
|
VARCHAR | 100 |
User Details
The User Details table is a dimension table that stores details on users.
| Field | Description | Additional Information | Data Type | Data Size |
|---|---|---|---|---|
| External Id | The external ID of the user. | VARCHAR | 255 | |
| First Name | The first name of the user. | VARCHAR | 255 | |
| Full Name | The full name of the user. | If the report is system generated, Scheduled Reports is displayed for the user name. | VARCHAR | 511 |
| Gender (Not in Use) | The gender of the user. | VARCHAR | 4000 | |
| Job Description | The job description of the user. | VARCHAR | 255 | |
| Job Title | The job title of the user. | VARCHAR | 255 | |
| Last Activity Date | The last date that a patron made a request or borrowed or returned an item. | DATE | ||
| Last Name | The last name of the user. | VARCHAR | 255 | |
| Middle Name | The middle name of the user. | VARCHAR | 255 | |
| Preferred First Name | Stores the user’s preferred first name. | VARCHAR | 255 | |
| Preferred Last Name | Stores the user’s preferred last name. | VARCHAR | 255 | |
| Preferred Middle Name | Stores the user's preferred middle name. | VARCHAR | 255 | |
| User Status | The status of the user. | VARCHAR | 8 | |
| User Group | The user group of the user. | VARCHAR | 4000 | |
| User Id | The user ID of the user. | VARCHAR | 50 | |
| User Primary Identifier | The primary identifier of the user | VARCHAR | 255 | |
| User Record Type | The record type of the user. | VARCHAR | 4000 | |
| User Title | The user title of the user. | VARCHAR | 4000 | |
| User Type | The user type of the user. | CHAT | 20 |
Institution
The shared Institution dimension allows the Network Zone to view reports according to institution. If an analytics report is run from the Network Zone in a collaborative network implementing a Network Zone, all member institutions are included in the report for Institution Code and Institution Name. If an analytics report is run from an institution that is not part of a collaborative network implementing a Network Zone, only the single institution from which the report is run is included in the report for Institution Code and Institution Name.
This dimension is available in every subject area. It contains the following fields:
| Field | Description | Additional Information | Data Type | Data Size |
|---|---|---|---|---|
| Institution Code | The code of the institution. |
Configured from: Configuration > General > Add a Library or Edit Library Information > Summary tab. The label in Alma is Code located on the right pane. |
VARCHAR | 50 |
| Institution Name | The name of the institution. |
Configured from: Configuration > General > Add a Library or Edit Library Information > Summary tab. The label in Alma is Organization unit name. |
VARCHAR | 255 |
| Institution Address Line 1 | The first line of the address of the institution. It usually includes the building number and the street name. |
Configured from: Configuration > General > Add a Library or Edit Library Information > Contact Information tab. This is taken from the address configured as the Preferred address. The label in Alma is Address Line 1. |
VARCHAR | 1000 |
| Institution City | The city of the institution. |
Configured from: Configuration > General > Add a Library or Edit Library Information > Contact Information tab. This is taken from the address configured as the Preferred address. The label in Alma is City. |
VARCHAR | 255 |
| Institution State Province | The state or province of the institution. |
Configured from: Configuration > General > Add a Library or Edit Library Information > Contact Information tab. This is taken from the address configured as the Preferred address. The label in Alma is State/Province. |
VARCHAR | 320 |
| Institution Country | The country of the institution. |
Configured from: Configuration > General > Add a Library or Edit Library Information > Contact Information tab. This is taken from the address configured as the Preferred address. The label in Alma is Country. |
VARCHAR | 320 |
| Institution Postal Code | The postal code of the institution. |
Configured from: Configuration > General > Add a Library or Edit Library Information > Contact Information tab. This is taken from the address configured as the Preferred address. The label in Alma is Postal code. |
VARCHAR | 200 |
| Institution Timezone | The timezone of the institution. | The timezone is set during implementation. | VARCHAR | 255 |
| Data Available As Of | When the institution data became available in analytics. | Displayed at the bottom of the main Analytics menu. | VARCHAR | 255 |
| Data Updated As Of | When the institution data was taken from the Alma database. | Displayed at the bottom of the main Analytics menu. | VARCHAR | 255 |
Page tags: article:topicproduct:almacontent:Documentationlang:english
