
Benchmark
Create analytics reports comparing the performance of your institution to similar institutions.
Using the Benchmark subject area, you can create analytics reports comparing the performance of your institution to similar institutions. These reports can can help you identify places in your workflow that can be improved.
- The institution must be live for at least one year.
- You must select Yes in Data Sharing Profile.
The following are some example of business questions that can be investigated with this subject area:
- What is the average time in my institution (compared to other institutions) from when the order is sent until the electronic resource is activated?
- What is the average time in my institution (compared to other institutions) from when the order is sent until the physical item arrives?
- What is the average time in my institution (compared to other institutions) for a physical item hold request to be processed?
- What is the percentage of loans in my institution (compared to other institutions) that were returned late?
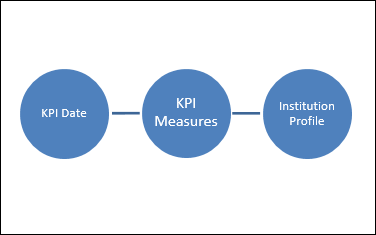
Field Descriptions
The following fields are available in Benchmark:
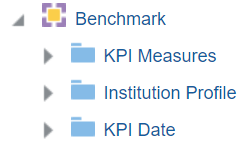
KPI Measures
The Key Performance Indicator (KPI) table is a fact table that stores all measures relating to KPIs. It is divided into the following areas:
- Inventory KPIs
- Acquisition KPIs - POLs
- Fulfillment KPIs - Requests
- Fulfillment KPIs - Loans
- Resource Sharing KPis - Borrowing Requests
- Resource Sharing KPis - Lending Requests
- Usage KPIs - COUNTER Reports
Inventory KPIs
| Field | Description | Additional Information |
|---|---|---|
| Total | ||
| Number of bibliographic records in repository (total) | The total number of bibliographic records in the repository | The value of this field is the monthly average by default. |
| Number of physical items in repository (total) | The total number of physical items in the repository | The value of this field is the monthly average by default. |
| Number of electronic portfolios in repository (total) | The total number of electronic portfolios in the repository | The value of this field is the monthly average by default. |
| Num of electronic portfolios in repository linked to CZ (total) | The total number of electronic portfolios in the repository that are linked to the community zone | |
| Num of electronic portfolios in repository not linked to CZ (total) | The total number of electronic portfolios in the repository that are not linked to the community zone | |
| Number of electronic collections in repository (total) | The total number of electronic collections in the repository | The value of this field is the monthly average by default. |
| Num of electronic collections in repository linked to CZ (total) | The total number of electronic collections in the repository that are linked to the community zone | |
| Num of electronic collections in repository not linked to CZ (total) | The total number of electronic collections in the repository that are not linked to the community zone | |
| Monthly | ||
| Number of bibliographic records in repository added (by month) | The number of bibliographic records added to the repository per month | |
| Number of physical items in repository added (by month) | The number of physical items added to the repository per month | |
| Number of electronic portfolios in repository added (by month) | The number of electronic portfolios added to the repository per month | |
| Number of electronic collections in repository added (by month) | The number of electronic collections added to the repository per month | |
Acquisition KPIs - POLs
| Field | Description | Additional Information |
|---|---|---|
| Num of PO Lines created (by month) | The number of PO lines created per month | |
| Num of PO Lines created (last 365 days) | The number of PO lines created in the last 365 days | |
| % of PO Lines originating from a purchase request | The percentage of PO lines that originate from a purchase request | |
| % of PO Lines originating from an API | The percentage of PO lines that originate from an API | |
| % of PO Lines originating from an import profile of type EOD | The percentage of PO lines that originate from an import profile of type EOD | |
| % of PO Lines originating from manual entry | The percentage of PO lines that originate from a manual entry | |
| Physical - Average days from POL sent to item arrival | The average number of days that passed from the sending of the PO line for physical items until they arrived | |
| Physical - Average days from POL creation to sent | The average number of days that passed from the creation of the PO line for physical items until they was sent | |
| Physical - Average days from POL creation to item arrival | The average number of days that passed from the creation of the PO line for physical items until they arrived | |
| Physical - Med days from POL sent to item arrival | The median number of days that passed from the sending of the PO line for physical items until they arrived | |
| Physical - Med from POL creation to sent | The median number of days that passed from the creation of the PO line for physical items until they were sent | |
| Physical - Med from POL creation to item arrival | The median number of days that passed from the creation of the PO line for physical items until they arrived | |
| Physical - 95% days from POL sent to item arrival | The number of days after the PO line was sent by which 95% of the physical items arrived | |
| Physical - 95% days from POL creation to sent | The number of days by which 95% of the items were sent after the PO line was created | |
| Physical - 95% days from POL creation to item arrival | The number of days by which 95% of the items were received after the PO line was created | |
| Electronic Portfolio - Average days from POL sent to portfolio activation | The average number of days that passed from the sending of the PO line for electronic portfolios until they were activated | |
| Electronic Portfolio - Average days from POL creation to sent | The average number of days that passed from the creation of the PO line for electronic portfolios until they were sent | |
| Electronic Portfolio - Average days from POL creation to portfolio activation | The average number of days that passed from the creation of the PO line for electronic portfolios until they were activated | |
| Electronic Portfolio - Med days from POL sent to portfolio activation | The median number of days that passed from the sending of the PO line for electronic portfolios until they were activated | |
| Electronic Portfolio - Med days from POL creation to sent | The median number of days that passed from the creation of the PO line for electronic portfolios until they were sent | |
| Electronic Portfolio - Med days from POL creation to portfolio activation | The median number of days that passed from the creation of the PO line for electronic portfolios until they were activated | |
| Electronic Portfolio - 95% days from POL sent to portfolio activation | The number of days by which 95% of the sent portfolios were activated | |
| Electronic Portfolio - 95% days from POL creation to sent | The number of days by which 95% of the created PO lines were sent | |
| Electronic Portfolio - 95% days from POL creation to portfolio activation | The number of days by which 95% of the created PO lines were activated | |
| Electronic Collection - Average days from POL sent to collection activation | The average number of days that passed from the sending of the PO line for an electronic collection until it was activated | |
| Electronic Collection - Average days from POL creation to sent | The average number of days that passed from the creation of the PO line for an electronic collection until it was sent | |
| Electronic Collection - Average days from POL creation to collection activation | The average number of days that passed from the creation of the PO line for an electronic collection until it was activated | |
| Electronic Collection - Med days from POL sent to collection activation | The median number of days that passed from the sending of the PO line for an electronic collection until it was activated | |
| Electronic Collection - Med days from POL creation to sent | The median number of days that passed from the creation of the PO line for an electronic collection until it was sent | |
| Electronic Collection - Med days from POL creation to collection activation | The median number of days that passed from the creation of the PO line for an electronic collection until it was activated | |
| Electronic Collection - 95% days from POL sent to collection activation | The number of days by which 95% of the sent PO lines for electronic collections were activated | |
| Electronic Collection - 95% days from POL creation to sent | The number of days by which 95% of the created PO lines for electronic collections were sent | |
| Electronic Collection - 95% days from POL creation to collection activation | The number of days by which 95% of the created PO lines for electronic collections were activated |
Fulfillment KPIs - Requests
| Field | Description | Additional Information |
|---|---|---|
| Number of patron physical item requests created (by month) | The number of patron physical item requests created per month | |
| Number of booking requests created (by month) | The number of booking requests created per month | |
| Number of digitization requests created (by month) | The number of digitization requests created per month | |
| Number of patron physical item requests rejected (by month) | The number of patron physical item requests rejected per month | |
| Number of patron physical item requests rejected by library (by month) | The number of patron physical item requests rejected by a library per month | |
| Number of patron physical item requests rejected by patron (by month) | The number of patron physical item requests rejected by a patron library per month | |
| Number of physical item requests that involved transits (by month) | The number of physical item requests that involved transits per month | |
| Average processing time physical item requests (date on hold shelf - date created) (last 365 days) | The average processing time for physical item requests for the last 365 days. (Calculated by the number of days between the date the physical item request was created and the date the item was placed on the hold shelf.) | |
| Med processing time physical item requests (date on hold shelf - date created) (last 365 days) | The median processing time for physical item requests for the last 365 days. (Calculated by the number of days between the date the physical item request was created and the date the item was placed on the hold shelf.) | |
| 95% processing time physical item requests (date on hold shelf - date created) (last 365 days) | The amount of processing time by which 95% of physical item requests were processed in the last 365 days. (Calculated by the number of days between the date the item request was created and the date the physical item was put on the hold shelf. |
Fulfillment KPIs - Loans
| Field | Description | Additional Information |
|---|---|---|
| Number of loans (In House+ Not In House) (by month) | The number of loans including in house and not in house loans per month | |
| Number of loans (In House) (by month) | The number of in house loans per month | |
| Number of loans (Not In House) (by month) | The number of not in house loans per month | |
| Number of returns (In House+ Not In House) (by month) | The number of returns including in house and not in house loans per month | |
| Number of returns (In House) (by month) | The number of in house returns per month | |
| Number of returns (Not In House) (by month) | The number of not in house returns per month | |
| Number of late returns (Not In House) (by month) | The number of not in house late returns per month | |
| Number of on time returns (Not In House) (by month) | The number of not in house on time returns per month | |
| % of late returns (by month) | The percent of late returns per month | |
| % of on time returns (by month) | The percent of on time returns per month | |
| Number of returns at non-owning library (Not In House) (by month) | The number of not in house returns at a non-owning library per month | |
| Number of returns at owning library (Not In House) (by month) | The number of not in house returns at an owning library per month | |
| % of returns at non-owning library (by month) | The percent of returns at a non-owning library per month | |
| % of returns at owning library (by month) | The percent of returns at an owning library per month | |
| Average expected loan period (due date - loan date) (last 365 days) | The average expected loan period for the last 365 days. (Calculated by the number of days between the due date and the loan date.) | |
| Average actual loan period (return date - loan date) (last 365 days) | The average actual loan period for the last 365 days. (Calculated by the number of days between the return date and the loan date.) | |
| Average loan days deviation from due date (average expected loan period - average actual loan period (last 365 days) | The average loan days deviation from due date for the last 365 days. (Calculated by the number of days between the average expected loan period and the average actual loan period.) | |
| Med expected loan period (due date - loan date) (last 365 days) | The median expected loan period for the last 365 days. (Calculated by the number of days between the due date and the loan date.) | |
| Med actual loan period (due date - loan date) (last 365 days) | The median actual loan period for the last 365 days. (Calculated by the number of days between the due date and the loan date.) | |
| Med loan days deviation from due date (med expected loan period - med actual loan period (last 365 days) | The median loan days deviation from due date for the last 365 days. (Calculated by the number of days between the median expected loan period and the median actual loan period. | |
| 95% expected loan period (due date - loan date) (last 365 days) | The expected loan period for 95% of the loans for the last 365 days. (Calculated by the number of days between the loan date and the due date.) | |
| 95% actual loan period (due date - loan date) (last 365 days) | The actual loan period for 95% of the loans for the last 365 days. (Calculated by the number of days between the loan date and the due date.) | |
| 95% loan days deviation from due date (P95 expected loan period - P95 actual loan period (last 365 days) | The number of loan days deviation from the due date for 95% of the loans for the last 365 days. (Calculated by the number of days between the actual loan period and the expected loan period. |
Resource Sharing KPIs - Borrowing Requests
| Field | Description | Additional Information |
|---|---|---|
| Number of borrowing requests created (by month) | The number of borrowing requests created by month | |
| Number of borrowing requests fulfilled (by month) | The number of borrowing requests fulfilled by month | |
| Number of borrowing requests rejected by all partners (by month) | The number of borrowing requests rejected by all partners by month | |
| % of borrowing requests rejected by all partners (by month) | The % of borrowing requests rejected by all partners by month | |
| Number of partner rejections of borrowing requests (by month) | The number of partner rejections of borrowing requests by month | |
| Number of consulted partners (last 365 days) | The number of consulted partners for the last 365 days | |
| Number of partners in rota (last 365 days) | The number of partners in rota for the last 365 days | |
| Average supply time for borrowing requests (last 365 days) | The average supply time for borrowing requests for the last 365 days | |
| Median supply time for borrowing requests (last 365 days) | The median supply time for borrowing requests for the last 365 days | |
| 95% supply time for borrowing requests (last 365 days) | The 95% supply time for borrowing requests for the last 365 days |
Resource Sharing KPIs - Lending Requests
| Field | Description | Additional Information |
|---|---|---|
| Number of lending requests created (by month) | The number of lending requests created by month | |
| Number of fulfilled lending requests (by month) | The number of fulfilled lending requests by month | |
| Number of non-fulfilled lending requests (by month) | The number of non-fulfilled lending requests by month | |
| % of lending requests created which were not fulfilled (by month) | The % of lending requests created which were not fulfilled by month | |
| Average supply time for lending requests (last 365 days) | The average supply time for lending requestsverage supply time for lending requests for the last 365 days | |
| Median supply time for lending requests (last 365 days) | The median supply time for lending requests for the last 365 days | |
| 95% supply time for lending requests (last 365 days) | The 95% supply time for lending requests for the last 365 days |
Usage KPIs - COUNTER Reports
| Field | Description | Additional Information |
|---|---|---|
| JR1 Journal usage | The journal usage of the previous calendar year | Calculated from the Usage Data Details > JR1 - Journal Usage Counter measure of the Usage Data subject area. |
| JR1a Journal Archive usage | ||
| BR1 Title Requests | The number of book searches of the previous calendar year | Calculated from the Usage Data Details > BR1 - Book Success Title Requests (total) measure of the Usage Data subject area. |
| BR2 Section Requests | ||
| DB1 Database views | The number of database views of the previous calendar year | Calculated from the Usage Data Details > DB1 - DB Records Views measure of the Usage Data subject area. |
| DB1 Database searches | The number of database searches of the previous calendar year | Calculated from the Usage Data Details > DB1 - DB Searches measure of the Usage Data subject area. |
| PR1 Platform searches | The number of platform searches of the previous calendar year | Calculated from the Usage Data Details > PR1 - Platform Regular Searches measure of the Usage Data subject area. |
| Number of unique platforms loaded | The number of unique platforms loaded of the previous calendar year | Calculated from the formula: Count (distinct "Platform"." Platform") of the Usage Data subject area. |
| Number of unique COUNTER reports loaded | The number of unique COUNTER reports loaded of the previous calendar year | Calculated from the formula: Count (distinct "Usage Data Details"." Load File ID") of the Usage Data subject area. |
| Number of unique JR1 COUNTER reports loaded | The number of unique JR1 COUNTER reports loaded | |
| Number of unique JR1a COUNTER reports loaded | The number of unique JR1a COUNTER reports loaded | |
| Number of unique BR1 COUNTER reports loaded | The number of unique BR1 COUNTER reports loaded | |
| Number of unique BR2 COUNTER reports loaded | The number of unique BR2 COUNTER reports loaded | |
| Number of unique DB1 COUNTER reports loaded | The number of unique DB1 COUNTER reports loaded | |
| Number of unique PR1 COUNTER reports loaded | The number of unique PR1 COUNTER reports loaded |
Institution Profile
| Field | Description | Additional Information |
|---|---|---|
| Primary areas of study that the institution serves | ||
| Serves Humanities | Indicates if the institution serves humanities | |
| Serves Social Sciences | Indicates if the institution serves social sciences | |
| Serves Sciences | Indicates if the institution serves sciences | |
| Serves Engineering | Indicates if the institution serves engineering | |
| Serves Multidisciplinary | Indicates if the institution serves multidisciplinary areas | |
| Serves Other | Indicates if the institution serves other areas | |
| Professional graduate schools of the institution | ||
| Has Medical School | Indicates if the institution has a medical school | |
| Has Dental School | Indicates if the institution has a dental school | |
| Has Public Health School | Indicates if the institution has a public health school | |
| Has Business School | Indicates if the institution has a business school | |
| Has Law School | Indicates if the institution has a law school | |
| Has Other School | Indicates if the institution has other graduate schools | |
| Organizations to which the institution belongs | ||
| Belongs to American Library Association (ALA) | Indicates if the institution belongs to the American Library Association (ALA) | |
| Belongs to American Association of Law Libraries (AALL) | Indicates if the institution belongs to the American Association of Law Libraries (AALL) | |
| Belongs to Association of Research Libraries (ARL) | Indicates if the institution belongs to the Association of Research Libraries (ARL) | |
| Belongs to Association of College and Research Libraries (ACRL) | Indicates if the institution belongs to the Association of College and Research Libraries (ACRL) | |
| Belongs to Canadian Library Association | Indicates if the institution belongs to the Canadian Library Association | |
| Belongs to Canadian Association of Law Libraries | Indicates if the institution belongs to the Canadian Association of Law Libraries | |
| Belongs to Australian Library and Information Association | Indicates if the institution belongs to the Australian Library and Information Association | |
| Belongs to Library and Information Association of New Zealand | Indicates if the institution belongs to the Library and Information Association of New Zealand | |
| Belongs to Association of European Research Libraries | Indicates if the institution belongs to the Association of European Research Libraries | |
| Belongs to German Library Association | Indicates if the institution belongs to the German Library Association | |
| Belongs to Other | Indicates if the institution belongs to other organizations | |
| Total annual amount spent | ||
| Total annual amount spent on all materials | The total amount spent on all materials | |
| Total annual amount spent on electronic materials | The total amount spent on electronic materials | |
| Total annual amount spent on physical materials | The total amount spent on physical materials | |
| Student body size | ||
| Total undergraduate student body size | The total undergraduate student body size | |
| Total graduate student body size | The total graduate student body size | |
| Institution type | The institution type | |
| Main source of library funding | The main source of library funding | |
| Is my institution | Indicates your institution | |
| Is network institution | Indicates a network institution | |
| Is consortia member institution | Indicates a consortia member institution | |
| Institution | Your intuition | |
KPI Date
| Field | Description | Additional Information |
|---|---|---|
| KPI date | Stores the KPI date in the date format 2/29/2012 | |
| KPI month key | Stores the month of the date in number format such as 2 for February | |
| KPI month | Stores the month of the date in month description format such as February | |
| KPI full month | Stores the month and the year of the date in a display format such as Feb 12 | |
| KPI quarter | Stores the quarter of the date in a display format such as Q1 | |
| KPI year | Stores the year of the date in string format such as 2012 | |
| KPI Year-Month | The year and the month in a format such as 2023-1 | |
| KPI date | Stores the Hierarchy column that allows the user to drill down from the year to the month to the specific loan date. Using this column provides the user with the option to view the accumulative measures in each level of the hierarchy. |
Page tags: article:topicproduct:almacontent:Documentationlang:englishInventory KPIsAcquisition KPIs - POLsFulfillment KPIs - RequestsFulfillment KPIs - LoansInstitution ProfileKPI Date
